I’ve mentioned it before, but I REALLY like PHPStorm when I’m doing my PHP development. It’s the closest I’ve found to a Visual Studio quality IDE for the PHP environment. I use the debugger frequently, but have run into some issues trying to get Laravel apps to debug properly. After some trial and error, I’ve finally figured out how to get it working.
Note: These directions assume that you already have a PHP Application configured properly for your Laravel environment. If you don’t know how to set this up, go to your project configuration, and add a new “PHP Web Application” and proceed from there.
Laravel applications don’t start in the root of your project code. They technically start in the “public” folder, which can cause issues when the debugger is looking for the appropriate files. To account for this, we will update our configuration to specify the path mapping for the files.
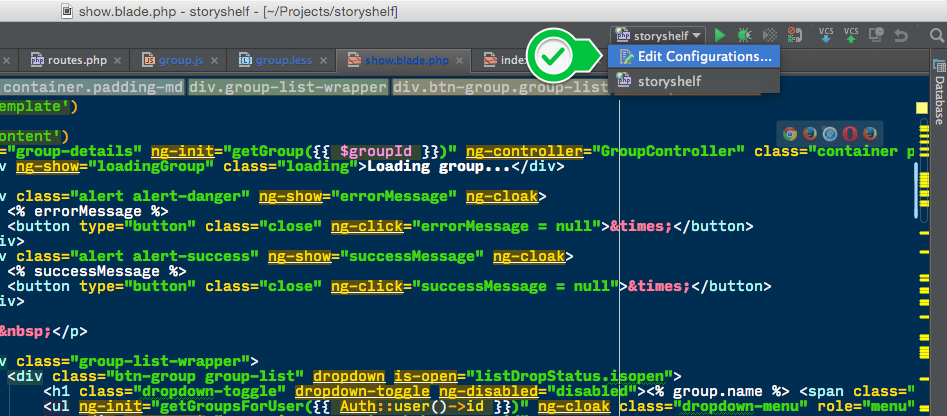
The first step is to click the drop down title for your application near the top right in PHPStorm and select “Edit Configuration”.
Next, select your PHP Web Application configuration and select the “…” button next to the server configuration name.
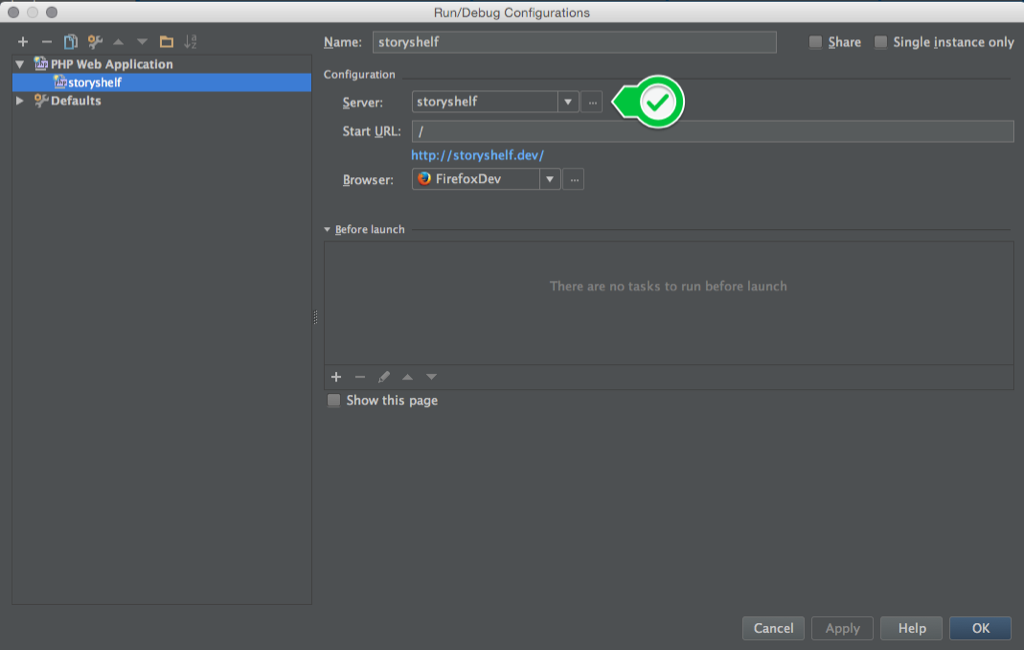
This brings up the server configuration window. Check the box that says, “Use path mappings” but don’t specify a path at this time. It seems weird to do it this way but this seems to be the only way to work for me. Click the “Apply” and then “OK” buttons.
Now, start up the debugger. You can click the “bug” icon next to the configuration drop down or use the hot key CTRL+D. This will fire up your browser of choice, but most likely the page will be blank. If PHPStorm doesn’t immediately take focus, switch back over to it.
You’ll notice that the console tab is selected, but nothing seems to be going on. If you click on the “Debugger” tab, then you’ll start to see what is going on.
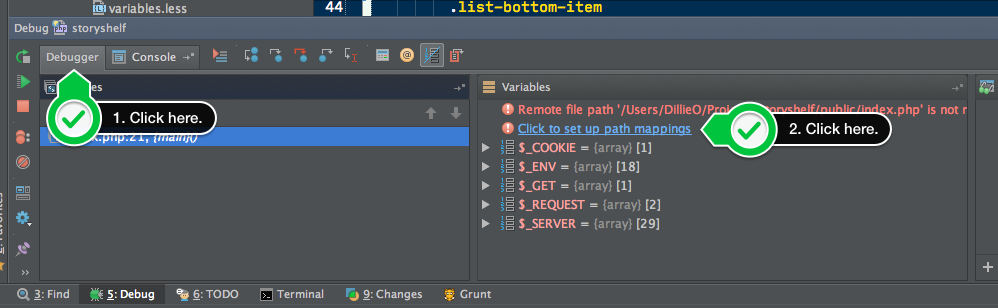
The debugger gives us a “nastygram” saying that file path is not properly setup to the main index.php file. There is a blue link right below that to setup the path mappings. Click that link.
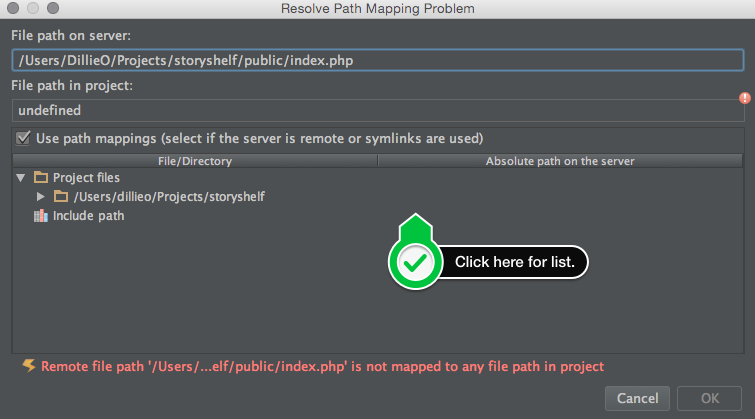
This brings up a window similar to what we had before to resolve path mappings. It’s hard to see in the dialog, but click in the empty space right next to where the main path is listed. This will bring up a drop down list. You’ll want to specify the project root path for your application, not the “public” folder.
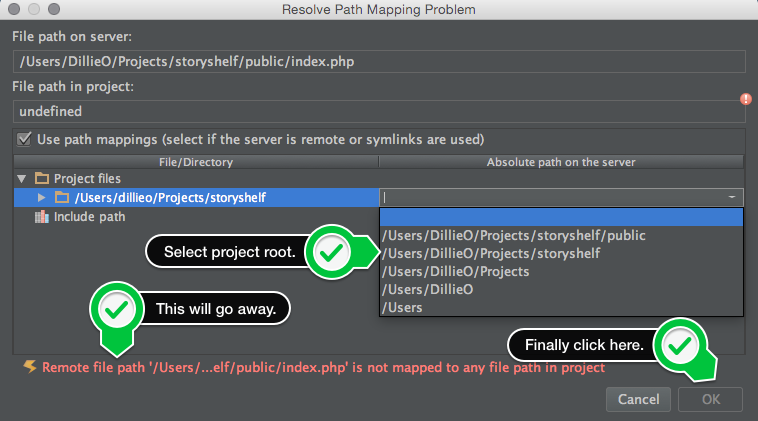
Once, you’ve selected the path, the red error message should disappear. Once it disappears, click the “OK” button. Once this happens the default index.php page will open and the debugger will be paused. From here, click the “resume” button over on the left hand side (it looks like a green play button with some grey lines next to it) or pretty the combination Option+Command+R.
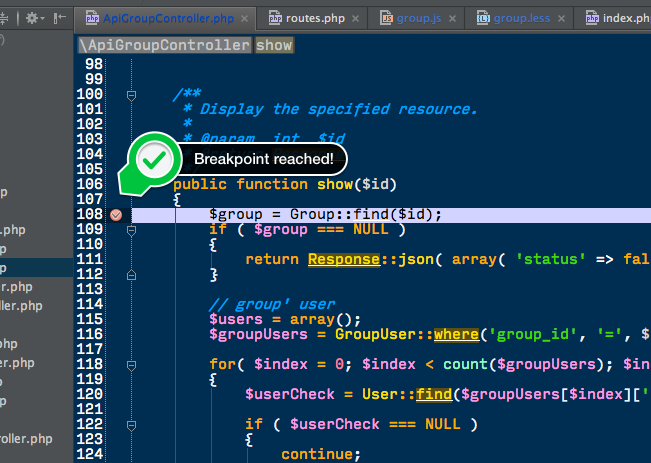
The next time you reach a point in your code where you have a breakpoint, PHPStorm will stop the execution and give you the debugging interface you’ve come to know and love.
Oddly enough, from time to time you’ll start the debugger and the breakpoints will no longer be hit. When this occurs, stop the debugger, and repeat the steps in this article, making sure to blank out the file path mapping before starting the debugger again.
Hope this helps!